Convexity describes the non-linear relationship between a financial instrument’s price and changes in market interest rates (yield). When depicted in graphical form, this price/yield relationship becomes a plot line that reveals a curvature that is convex in shape. This convex price/yield phenomenon is where the term convexity was applied to risk of financial instruments. Convexity essentially shows how the duration of an investment changes as interest rates change by greater degrees. If an instrument’s price/yield relationship remained perfectly linear regardless of the amount of rate moves, duration would be sufficient, but this is not the case for most financial instruments.
Financial instruments typically exhibit two types of convexity: negative or positive. Negative convexity is found in instruments with embedded options, while positive convexity is found in instruments without embedded options.
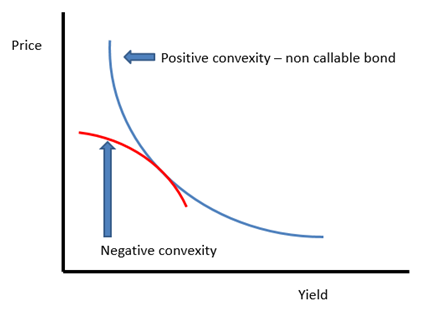
A positively convex financial product’s price will increase at an increasing rate when rates decline; when rates rise, the price declines at a decreasing rate. Conversely, a negatively convex financial instrument’s price increases at a decreasing rate when rates decline; when rates rise, the price of a negatively convex instrument will decline at an increasing rate. In addition, negative convexity causes the duration of an option-based investment to lengthen when rates rise and shorten when rates fall.
The chart below displays the price change differential between a non-callable bond (positive convexity) and a callable security (negative convexity). As yields decline, the price of a non-callable bond will continue to rise because of the fixed cash flow stream. The callable security’s price will begin to level out as the bond moves from being priced to maturity to being priced to the call date, essentially changing its effective duration. Because of these embedded options, investors are compensated for the additional risk with more yield. This price change due to the movement in the maturity of the callable bond is captured by the graph. Durations lengthen for securities with negative convexity when interest rates rise and shorten when interest rates fall. Neither movement is attractive to investors who buy and own the asset.
Calculating the convexity of a financial instrument or portfolio of financial instruments is an effective IRR measurement tool because it can help identify the amount of market risk and IRR to which an instrument or portfolio is exposed. High amounts of negative convexity in a portfolio of assets demonstrates that the portfolio is more prone to price risk (sensitivity) than a portfolio with no (or lesser amounts of) negative convexity. Understanding which instruments have material amounts of convexity, at the instrument and portfolio levels, can also provide risk managers with a reliable way to spot-check whether their NEV simulation results reasonably capture the price risk of embedded options.
Last updated October 11, 2016